Time and space are considered the most well-known dimensions in our universe. In data analysis, time has proven to be a fundamental perspective; we measure turnover rates over the course of a year; employee engagement rates over the course of a quarter, and any other examples that the important unit for scaling is time. While time can easily be measured and represented by data visualization, demonstration of space in the form of a data visualization might not be a super easy task.
Geographical visualization of the data in an old-fashioned way might not be helpful and add unexpected misleading interpretation to your data visualization.
As long as any other type of data visualization might require necessary steps and hesitation, spatial visualization will also require those steps too. But BStreams provide an easy interface for geospatial visualization that you don’t need to be very expert and professional about coordinates and maps.
Where to start?
Probably you might notice the Map chart section in the Chart panel while you were using the BStreams; or Add Coordinate button on the edit dataset section. Notice that it is very important to use the map charts you need to have the coordinates for each row of your data in the dataset.
Hence if your dataset has the geospatial fields (coordinates) which in-depth are Latitude and Longitude you are good to go to the next level and enjoy the geospatial visualization on the BStreams. But if your dataset does not contain coordinates, but includes geocoding fields such as Address, Zip code, Cities, regions, provinces, Countries, ISO code, and sightseeing, no worries. BStreams will help you to acquire the coordinates regarding your data.
Drag and Drop your fields
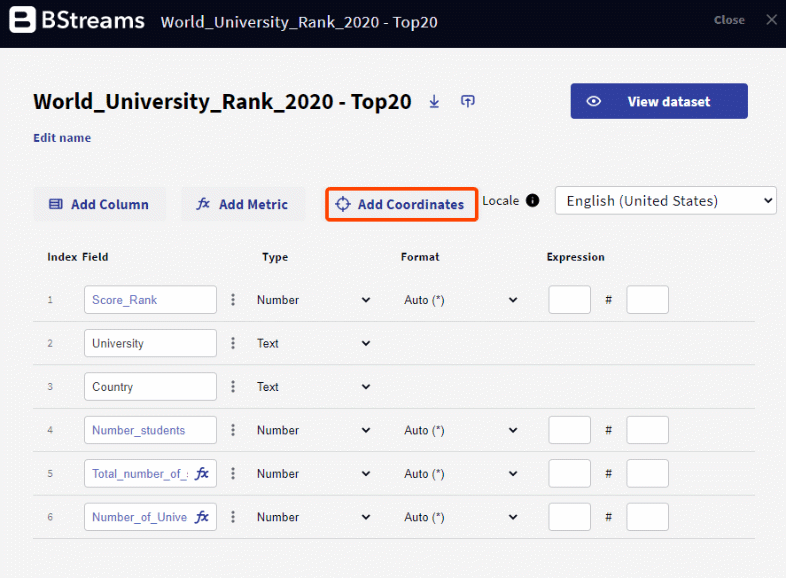
It is super easy to add coordinates to your dataset. From the Edit dataset section, you can have access to a variety of useful tools that are embedded there for enriching and unifying your data. One of the tools is the “Add Coordinates” button. You just need to follow these easy steps :
- Click on the Add Coordinate button
- Drag and Drop the geocoding fields
- We suggest you if your dataset contains more than one geocoding field like a combination of Address and Region/Province/City, zip code/Postcode and City/Country, or any other combination that might help us to retrieve accurate coordinates from your data, drop the fields into the geocoding section.
- Click on the create.
- Based on the size of your dataset you have to wait for the results. As long as your dataset is smaller the quicker BSteams is able to derive the coordinates.
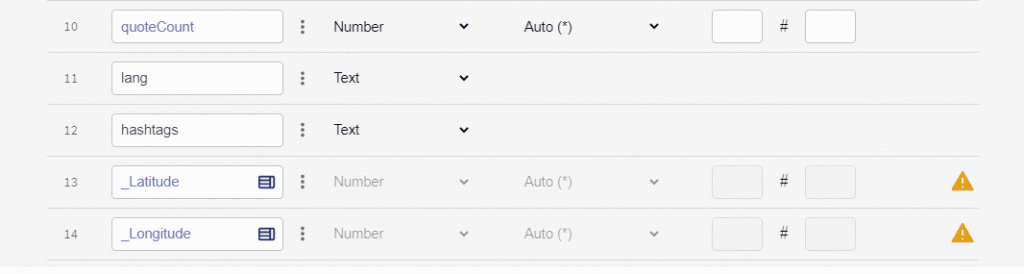
- On the Edit dataset panel, you can see two other fields by the title of “_Latitude” and “_Longitude” which are empty.
- When the process is finished you will be notified from the notification bar.
- Check your dataset from the Edit dataset panel.
- If there is no behind your _Latitude and _Longitude fields it means. That the BStreams was able to retrieve completely all the coordinates regarding your data. Unless you can check which rows of your data might contain misleading or wrong information the BStreams was not able to acquire the coordinates correctly.
Null values, and solutions
If you have null values for the coordinates in your dataset you are giving some approaches to solve the problem.
First, you need to check which row(s) of your data is exactly assigned to null coordinates. From the View dataset panel, you are able to sort each field in an ascending or descending manner.
Be sure that the information on the geocoding fields is accurate and updated.
You can update your dataset by using the “update” dataset tool on the Dataset panel and start over the process again to retrieve accurate coordinates from your dataset.
Want to learn more about maps? Email us at support@bstreams.io
If you haven’t checked our blog yet, give it a look and let us know what you think about it.
Read more here